🎣 Honey, Hold My Beer
Here are the Top 500 fleets of 2026. Plus: Sierra snow shuts down I-80, rail targets truckload freight, and ocean rates fall.
Deeper compliance starts with ISS and BASIC scores, offering brokers critical safety insights unavailable in OOS data to reduce liability and protect shippers.


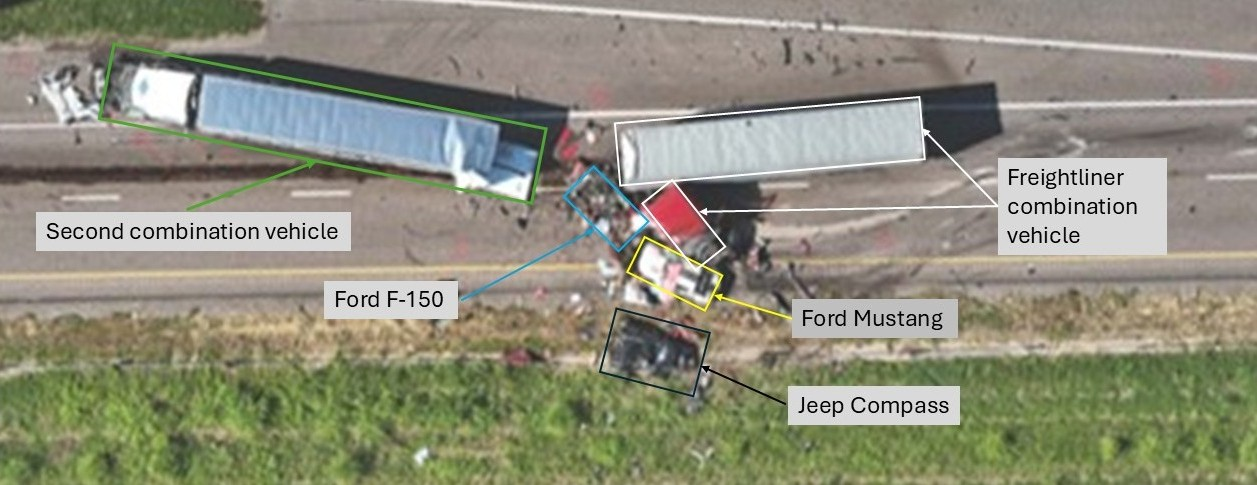
Brokers are under increasing scrutiny when it comes to carrier selection, especially after high-profile crashes. One recent example was Covenant Logistics subcontracting a USPS load to Hope Trans LLC, a carrier that was later involved in a crash that killed five people. As FreightCaviar reported, the company’s [Hope Trans] safety profile had clear warning signs, yet those risks went unnoticed until it was too late.

The problem is that most vetting processes rely heavily on publicly available data such as Out of Service (OOS) rates. While OOS percentages tell part of the story, they often fail to capture a more complete picture of carrier safety risk.
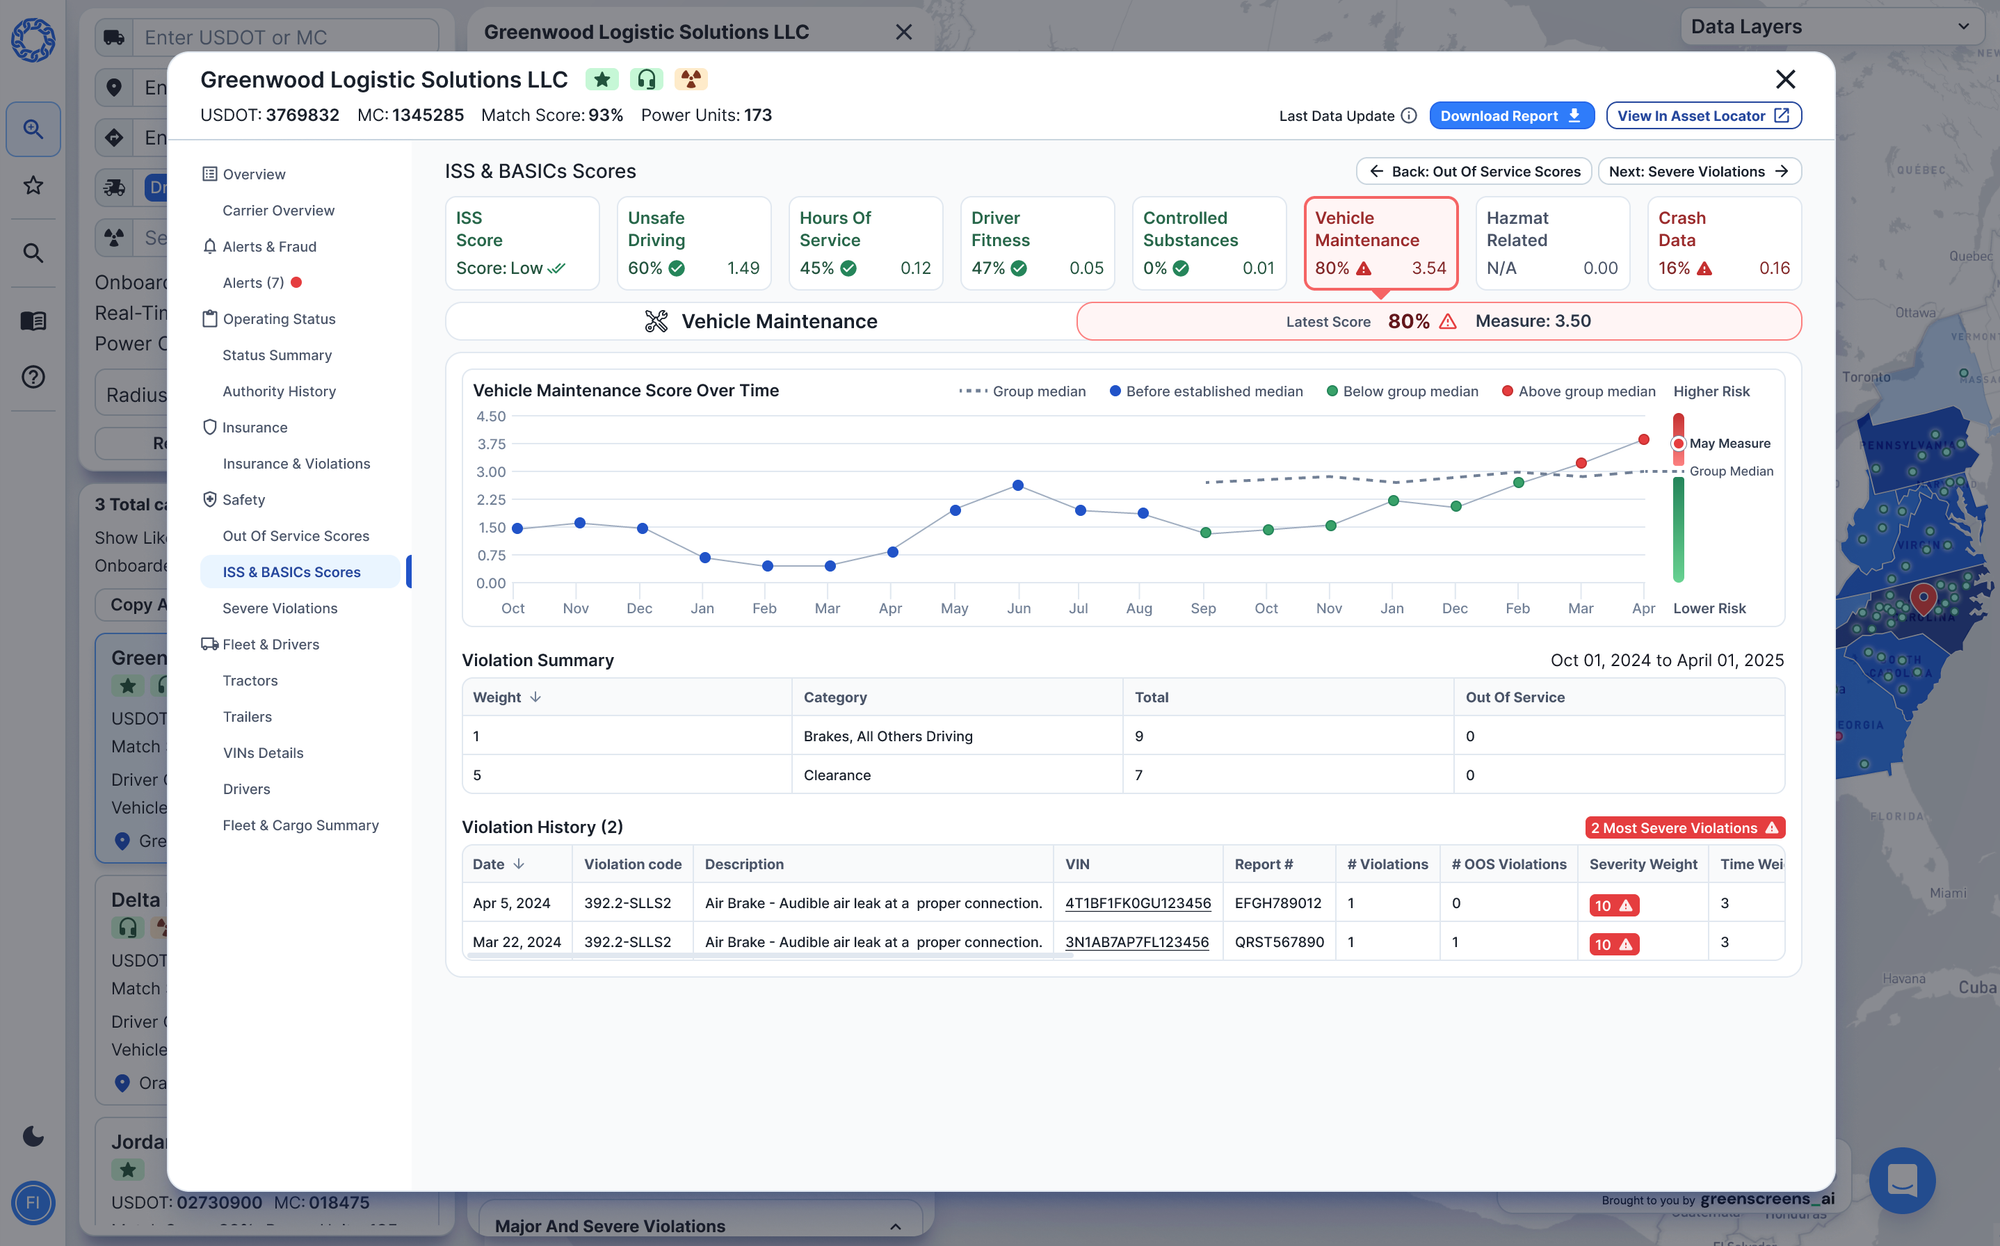
FMCSA tracks carrier safety through Behavior Analysis and Safety Improvement Categories (BASICs). These cover areas such as unsafe driving, hours-of-service compliance, and vehicle maintenance. The raw measures behind these categories are public and can be viewed on FMCSA’s Safety Measurement System (SMS).
Behind the scenes, FMCSA goes further by converting those measures into percentile scores that compare each carrier against its peers. These percentile scores are a better indicator of relative risk, the higher the percentage, the worse a carrier looks. However, these scores are not publicly available. Carriers can see their own, but brokers and shippers cannot.
The ISS score goes one step further. It consolidates all the BASIC percentiles into a single score ranging from 1 to 100. Roadside inspectors use ISS scores to decide whether a carrier should be bypassed, inspected, or targeted for further review. Like the BASIC percentiles, ISS scores are only visible to the carrier itself, not to the brokers who may be tendering them freight.
OOS rates alone provide a narrow snapshot. They don’t show how a carrier compares across the industry or highlight risk trends over time.
ISS and BASIC percentages fill that gap. They offer a holistic view of carrier performance and safety risk. For instance, Hope Trans LLC had ISS and BASIC scores close to 99%, the highest possible risk category, well before the crash that killed five people. That risk was visible in FMCSA’s internal scoring, but not in the data brokers typically use.


For brokers, the stakes are both regulatory and reputational. Missing these deeper compliance signals not only increases exposure to liability but can also erode trust with shippers who expect due diligence.
This is where GenLogs comes in. By reverse-engineering FMCSA’s non-public BASIC percentages and ISS scores, GenLogs gives brokers access to a level of insight that has traditionally been limited to carriers and regulators.
No other vetting or compliance platform currently offers this visibility. Beyond the data, GenLogs layers in additional intelligence from its network of roadside cameras, helping flag issues like hazmat violations, out-of-service events, or hours-of-service concerns.

Industry experts are taking notice. Matthew Leffler, better known as the Armchair Attorney, has referred to GenLogs as “the new standard of care” for broker compliance. According to GenLogs, its tools have helped customers avoid costly nuclear verdicts and meet the growing demand from shippers for stronger compliance measures in carrier selection.
Access to ISS and BASIC percentages gives brokers a stronger foundation for compliance, risk management, and liability reduction. By going beyond OOS rates, brokers can identify risks earlier, protect their shipper partners, and contribute to safer freight operations across the industry.

This shift also aligns with the industry’s trends pushing for more transparency and accountability in carrier selection. As expectations rise, brokers who fail to incorporate deeper compliance data may find themselves falling behind.
Traditional reliance on OOS rates is no longer sufficient. ISS and BASIC percentage scores provide a deeper, more accurate picture of carrier safety risk, insight that was once off-limits to brokers.
With access to these scores, brokers now have the opportunity to raise the standard of compliance, protect their customers, and reduce exposure to catastrophic losses.
Learn more at GenLogs.
Join over 14K+ subscribers to get the latest freight news and entertainment directly in your inbox for free. Subscribe & be sure to check your inbox to confirm (and your spam folder just in case).