🎣 Audit Targets Non-Resident CDLs
Plus: Canada backs off digital tax after tariff threats, Werner beats a $100M verdict, Samsara teams up with HappyRobot to bring AI voice into freight ops... and more in today's newsletter.
Experts offer insights into the freight market's cyclical behavior and future direction using the DVSMCI indicator in a post-COVID landscape.

Understanding patterns and predictive data is invaluable to understanding the freight sector. Two recent analyses by industry experts shed some light on the cyclical nature of the freight market and its nuances in a post-pandemic world.
Craig Fuller, founder of FreightWaves, highlighted the consistency of the freight cycle, which traditionally spans three years. COVID-19, while unpredictable in its impacts, surprisingly didn't deviate from this rhythm. The COVID freight cycle began April 18, 2020, and wrapped up on May 12, 2023 — lasting three years and three weeks. This shows that even against a backdrop of global turmoil, the freight market expanded and corrected as expected.
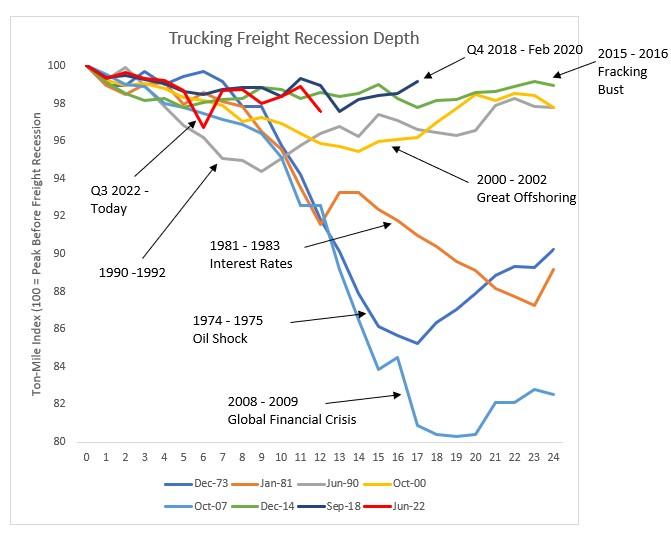
Responding to Fuller, Jason Miller, a supply chain professor, confirmed the three-year cycle observation and offered deeper historical context. He cited the ton-mile index he compiles, revealing that the current freight recession is deeper than the ones in 2019 and 2015-2016, showing roughly a 2% decline in ton-miles from its peak.
For comparison, the late 2000-2002 offshoring boom experienced a 5% drop, while three notably severe declines were the 1981-1983 interest rate spike, the 1974-1975 oil shock, and the substantial 2008-2009 Global Financial Crisis downturn, which suffered nearly a 20% ton-mile reduction.

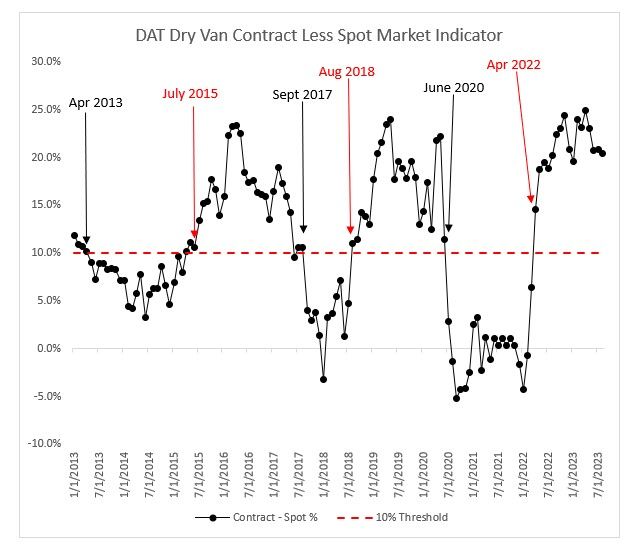
Miller, in his own post, goes on to describe the Dry Van Spot Market Cycle Indicator (DVSMCI), which uses the difference between contract and spot rates for dry vans to predict market movements.
Miller explains its significance: when the DVSMCI surpasses a 10% threshold, it signals the onset of a bear market. This was evident in July 2015, August 2018, and April 2022 — periods historically associated with market cooling. Conversely, bull markets emerged in May 2013, October 2017, and July 2020, each a month following the DVSMCI dropping below 10%.

Miller's detailed analysis harmonizes with Fuller's assessment, offering a layered understanding of the freight market's dynamics — essential reading in the unpredictable post-COVID landscape.
Sources: Craig Fuller/LinkedIn, Jason Miller/LinkedIn
Join over 12K+ subscribers to get the latest freight news and entertainment directly in your inbox for free. Subscribe & be sure to check your inbox to confirm (and your spam folder just in case).