
Podcasts
🎣 Real Carrier Data
"I think this is just one more way that you can go about finding quality capacity to better run your operation.”
"I think this is just one more way that you can go about finding quality capacity to better run your operation.”
A 20-year veteran of the freight industry, with 60k TikTok followers, argued that small carriers can't survive without brokers. Plus: the FBI's PSA, Steam Logistics sues two of its own, Ohio Turnpike comes for 315 carriers, and more.
Plus, Utah hands down an $81M nuclear verdict, hundreds of Mexican driver visas revoked at the border, Q1 earnings roundup, and more in today's newsletter.

Explore a 20-year analysis of U.S. trade shifts with China and the rise of South and Southeast Asian countries as significant trading partners.


China-U.S. Trade Shift Over 20 Years
Since 2010, China’s dominance as the top non-North American trading partner with the U.S. has seen a gradual decline. In 2010, China had a market share of 44.5%, which peaked to 50.1% with Hong Kong included. After a spike in 2018, due to increased tariffs, the share fell to 35.8% in 2023.
Top Commodity Categories and Market Shift
Between 2016 and 2022, the top 10 U.S. import categories (2-digit HS codes) showed various shifts. China experienced growth in seven of these categories, but lost market share in five of them. Despite this, China remained the dominant Country of Origin (CoO) in eight out of the ten categories.
Rise of South and Southeast Asian Countries
South and Southeast Asian countries like India, Bangladesh, Vietnam, Thailand, and Indonesia showed significant growth over this period, taking import share from China. Conversely, industrially mature markets like Europe, South Korea, and Japan did not experience this shift.
Category-Specific Analysis
Each category showed different trends. For instance, HS-94 (Furniture, Bedding, etc.) imports from China grew 5%, but its share decreased by 17.3%. Vietnam saw the most growth in this category, at 186.3%. On the other hand, HS-85 (Electronic Machinery, Sound Equipment, TV Equipment, etc.) saw phenomenal growth from Vietnam at 556.3%.
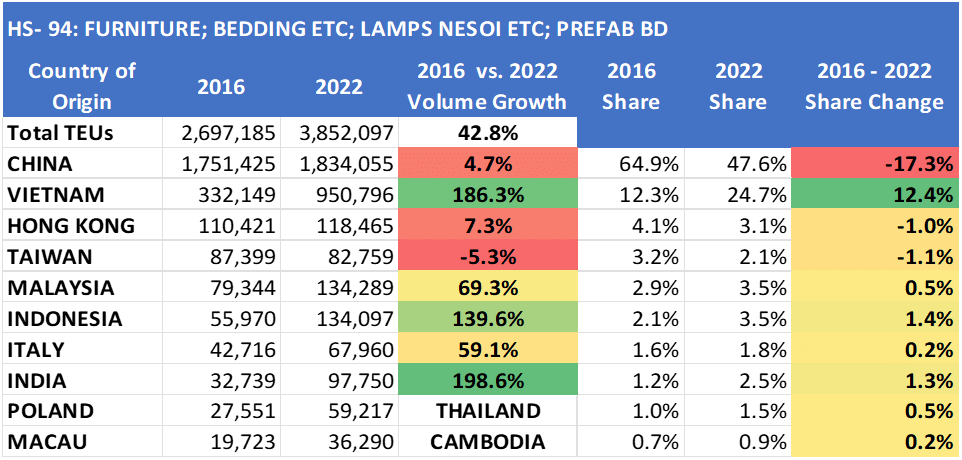
From 2016 to 2022, China's market share in the U.S. for HS-94 category (Furniture, Bedding etc.) decreased by 17.3%, while Vietnam, demonstrating the most growth among other countries, increased its market share by 12.4%.
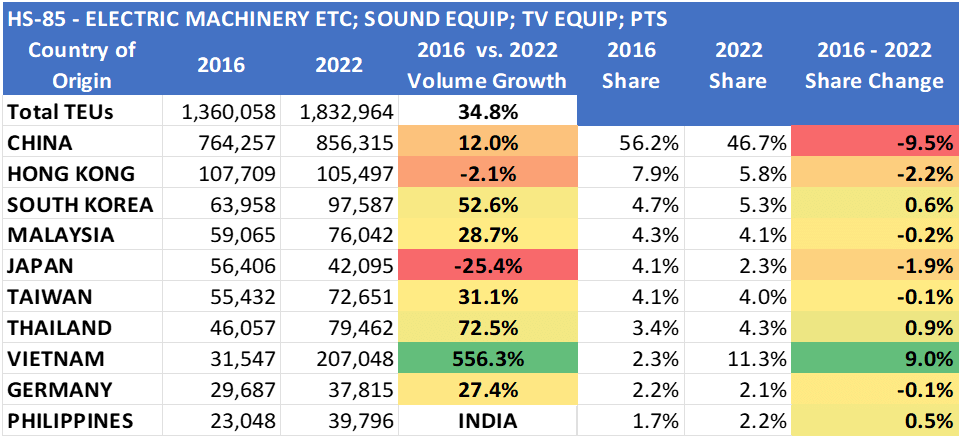
Between 2016 and 2022, the U.S. import market share of China in the HS-85 category (Electric Machinery etc.) decreased by 9.5%, while Vietnam's share drastically increased by 9.0%, showing the highest growth among all countries.
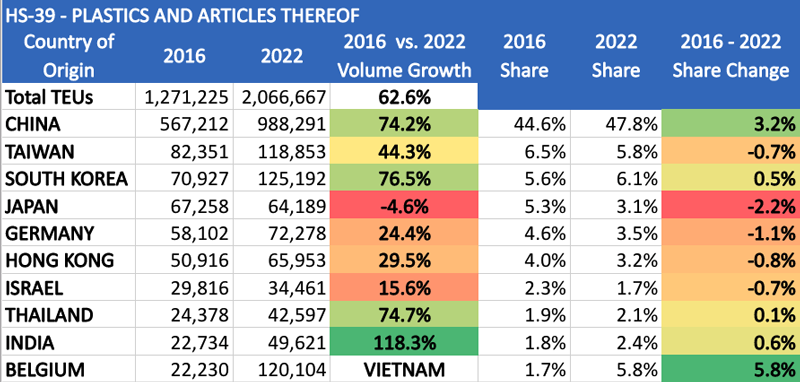
From 2016 to 2022, the share of China in the U.S. import market for HS-39 category (Plastics and Articles Thereof) increased by 3.2%, while Belgium made the most significant progress with a share increase of 5.8%.
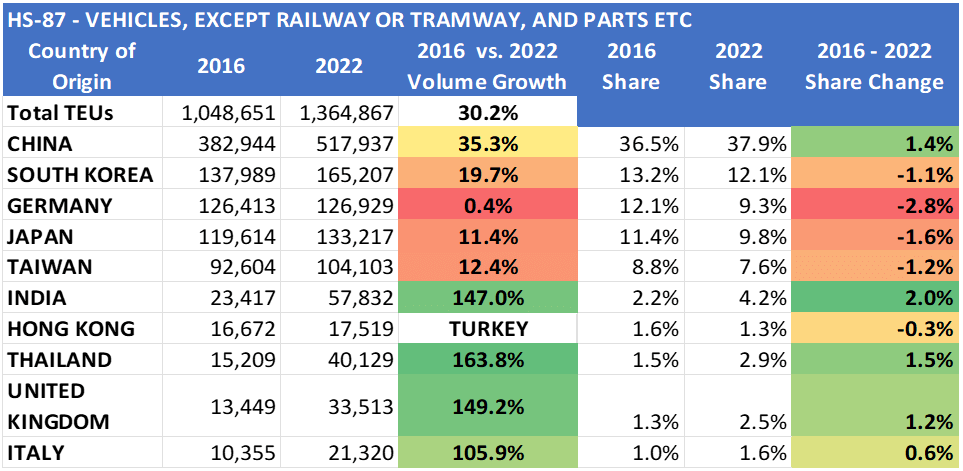
From 2016 to 2022, India had the highest growth in the U.S. import market for HS-87 category (Vehicles, Except Railway or Tramway, and Parts Etc), increasing its share by 2%, while China maintained the largest share, albeit with a modest increase of 1.4%.
Trade policies are causing real changes in the US-China relationship.
— Benjamin Gordon 🇺🇦🚚✈️ (@benjaminhgordon) June 12, 2023
Since the imposition of tariffs on China in 2018, China's share of US container imports have dropped from 48% to 38%.#logistics #supplychain #Asia pic.twitter.com/k7teaND3Bp
Source: Descartes

Plus, the offshore dispatchers your safety score can't catch, why Hormuz stays closed even after the war ends, what Triumph Financial's invoice volumes say about where freight is headed, and more.

Plus, diesel's rising price streak finally snaps, a 13-year shipper relationship ends in a $726K lawsuit, Congress takes a real swing at cargo theft, and more in today's newsletter.

Plus, C.H. Robinson's 2026 rate forecast update, Hormuz tankers still stuck, a $1M LEGO heist, and more.

The March LMI reads like 2022 with prices at a 4-year high. Plus: warehouse arson in California, Mexico's trucker strike enters day three, and broker margins are still underwater.
Join over 14K+ subscribers to get the latest freight news and entertainment directly in your inbox for free. Subscribe & be sure to check your inbox to confirm (and your spam folder just in case).